- ABOUT KOREA INNOVATION CLUSTER
- Korea Innovation Foundation
- INFORMATION
- GLOBAL COOPERATION
- SEARCH
- Online Exhibition of INNOPOLIS
- OTHER
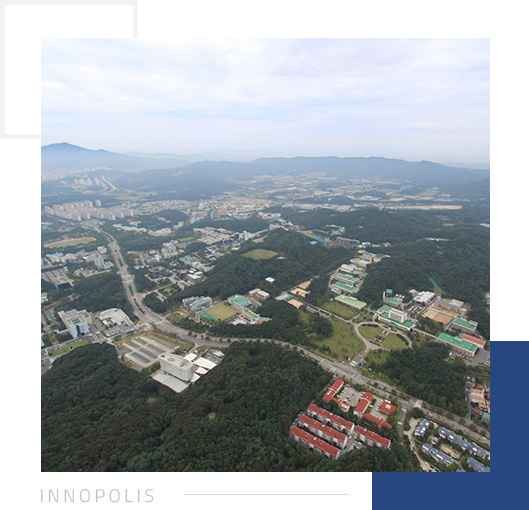
INNOPOLIS Jeonbuk
KOREA INNOVATION FOUNDATION Publications
INNOPOLIS Jeonbuk statistics ('15~'22)
Innopolis General
-
No. of Tenants
-
Turnover
-
Total R&D Investment
-
Employment
Innopolis Performance
-
Registered Internal Patents(Cumulative)
-
Registered External Patents(Cumulative)
-
Technology Transfer Fee/No. of Technology Transfer
Corporate Status
-
Enterprises listed on the KOSDAQ
-
INNOPOLIS Research-Based Spin-off Companies
-
High-tech Research Companies
Tenant Institutes Status
As of December 2022 (Unit: No)
| Classification | Research field | Non-research field | Corporations | Total | ||||||||
|---|---|---|---|---|---|---|---|---|---|---|---|---|
| Public Research Insititutes |
Other Research Institutes |
Sum | Government and Public Institutes |
Other Non-profit Institutes |
Sum | |||||||
| Government Research Institutes |
Universities | Specialized Production Technology Institutes |
National and Public Research Institutes |
Government Institutes |
Public Institutes |
|||||||
| 2022 | 7 | 4 | 1 | 5 | 6 | 23 | 2 | 13 | 2 | 17 | 740 | 780 |
| 2021 | 7 | 4 | 1 | 5 | 5 | 22 | 0 | 9 | 1 | 10 | 713 | 745 |
| 2020 | 7 | 4 | 1 | 5 | 6 | 23 | - | 7 | 1 | 8 | 753 | 784 |
| 2019 | 7 | 4 | 1 | 5 | 4 | 21 | - | 7 | - | 7 | 623 | 651 |
| 2018 | 7 | 4 | 1 | 5 | 4 | 21 | - | 6 | - | 6 | 534 | 561 |
| 2017 | 7 | 4 | 1 | 5 | 4 | 21 | - | 6 | - | 6 | 482 | 509 |
| 2016 | 6 | 4 | 1 | 5 | 4 | 20 | - | 6 | - | 6 | 450 | 476 |
| 2015 | 6 | 4 | 1 | 5 | 4 | 20 | - | 6 | - | 6 | 411 | 437 |
Sales Status
As of December 2022 (Unit: 1 million KRW)
| Classification | 2015 | 2016 | 2017 | 2018 | 2019 | 2020 | 2021 | 2022 |
|---|---|---|---|---|---|---|---|---|
| Corporations Sales |
2,426,814 | 2,549,259 | 3,283,755 | 3,713,029 | 3,640,936 | 3,549,662 | 3,658,249 | 3,928,278 |
R&D expenditure
As of December 2022 (Unit: 1 million KRW)
| Classification | Self-funded R&D |
Externally-funded | R&D Total R&D |
|---|---|---|---|
| 2022 | 186,361 | 471,095 | 657,456 |
| 2021 | 215,505 | 425,565 | 641,070 |
| 2020 | 180,583 | 407,543 | 588,126 |
| 2019 | 122,821 | 421,315 | 544,136 |
| 2018 | 132,532 | 424,912 | 557,444 |
| 2017 | 122,816 | 429,727 | 552,543 |
| 2016 | 60,939 | 488,145 | 549,084 |
| 2015 | 70,932 | 459,531 | 530,463 |
Manpower Status
As of December 2022 (Unit: Persons)
| Classification | Researchers & engineers (A) | Production workers, administrative workers (B) |
Number of employees (A)+(B) |
|||
|---|---|---|---|---|---|---|
| Doctors | Masters | Bachelors and below |
Total | |||
| 2022 | 4,987 | 2,617 | 1,988 | 9,592 | 18,008 | 27,600 |
| 2021 | 4,774 | 2,423 | 1,897 | 9,094 | 15,969 | 25,063 |
| 2020 | 4,893 | 1,532 | 1,227 | 7,652 | 11,521 | 19,173 |
| 2019 | 5,125 | 1,533 | 1,164 | 7,822 | 11,753 | 19,575 |
| 2018 | 4,787 | 1,640 | 1,211 | 7,638 | 12,773 | 20,411 |
| 2017 | 4,761 | 1,798 | 1,237 | 7,796 | 11,143 | 18,939 |
| 2016 | 5,085 | 1,565 | 804 | 7,454 | 10,316 | 17,770 |
| 2015 | 5,075 | 1,430 | 586 | 7,091 | 8,985 | 16,076 |
Research Achievement
As of December 2022 (Unit: 1 million KRW)
| Classification | Domestic patents (Cumulative) | Overseas patents (Cumulative) | Number of technology transfers |
Technology transfer fees |
||
|---|---|---|---|---|---|---|
| Patents pending | Registered patents | Patents pending | Registered patents | |||
| 2022 | 15,375 | 15,375 | 1,552 | 496 | 1,649 | 9,181 |
| 2021 | 14,617 | 10,983 | 1,319 | 352 | 1,584 | 6,811 |
| 2020 | 13,770 | 9,902 | 1,186 | 281 | 1,575 | 6,736 |
| 2019 | 12,818 | 8,940 | 1,083 | 171 | 1,959 | 5,508 |
| 2018 | 11,793 | 8,528 | 923 | 172 | 1,621 | 5,218 |
| 2017 | 11,830 | 7,933 | 848 | 157 | 1,001 | 5,278 |
| 2016 | 9,704 | 6,378 | 676 | 122 | 330 | 2,645 |
| 2015 | 8,124 | 5,019 | 624 | 91 | 315 | 2,550 |
Enterprise listed in KOSDAQ in INNOPOLIS
As of December 2022 (Unit: No)
| Classification | `15 | `16 | `17 | `18 | `19 | `20 | `21 | `22 |
|---|---|---|---|---|---|---|---|---|
| Number of Corporation | 3 | 3 | 4 | 4 | 5 | 6 | 6 | 6 |
Research Institute Establishment Status (Cumulative)
As of December 2022 (Unit: No)
| Classification | `15 | `16 | `17 | `18 | `19 | `20 | `21 | `22 |
|---|---|---|---|---|---|---|---|---|
| Establishment (Cumulative) |
3 | 22 | 47 | 74 | 112 | 143 | 170 | 195 |
High-tech Research Companies Designation Status (Cumulative)
As of December 2022 (Unit: No)
| Classification | `15 | `16 | `17 | `18 | `19 | `20 | `21 | `22 |
|---|---|---|---|---|---|---|---|---|
| Designation (Cumulative) |
3 | 7 | 10 | 13 | 19 | 21 | 23 |
OVERVIEW
-
About KOREA INNOVATION FOUNDATION
KOREA INNOVATION FOUNDATION is a professional technology commercialization institution to efficiently pursue the business of fostering according to the Special Act on the Promotion of Special Research and Development Zones, Etc.
-
About the INNOPOLIS
With the diffusion of the INNOPOLIS model to other regional hubs, total five INNOPOLISes are currently in operation, making significant contributions to balanced regional development in South Korea.
THE INNOPOLIS MODEL
The INNOPOLIS Model The INNOPOLIS, as an R&D-focused innovation cluster, is contributing to national economic growth via intellectual property creation and technology commercialization. INNOPOLIS creates an Innovation Cluster with a Virtuous Circle of R&D, Tech Commercialization, Re-investment
STP
-
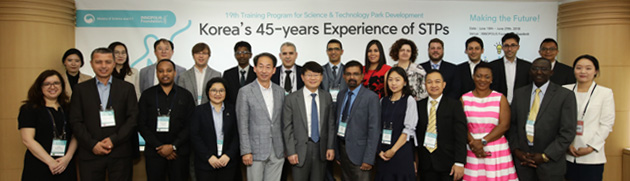
Characteristics of STP Training Program
The STP training program has introduced Korean style of management system for Science & Technology Parks(STPs). Participants of the STP program will get hands on know-how on development, operation and management of STP
-

Sharing the know-how
-

Customized Solution
-

Building a social network
-

Hands on experience
-
STP Photos